
How to Look Up Lee County Jail Population Data
The core source for Lee County jail population data is the Lee County Sheriff's Office Corrections Bureau page at sheriffleefl.org/corrections-2. The page lists each of the three corrections sites, their security level, role inside the system, rated bed count, and a recent average daily population figure. The Sheriff also publishes program notes on the same page. The Corrections Bureau page is the official anchor for any Lee County jail population search.
The first thing on the page is a short facility list. Each facility has one bed-count number next to it. Those are rated capacities, not live counts. The second key number is the average daily population, posted as a single annual figure with a comparison to the year before. The page does not show a live in-custody total. For a live in-custody check, the Sheriff routes users to the booking search and the public records process under Florida Statutes Chapter 119.
Update cadence is not stamped on the page. The capacity table reads as static. The average daily population number gets refreshed once a year. For finer cuts, such as a date or a specific booking, the Sheriff posts the booking search and a public-records contact. Lee County jail population numbers from the Corrections Bureau page should be treated as the official top-line view, with the booking system used for day-level questions.
A second source helps with state-prison context. The Florida Department of Corrections runs an inmate population search at pubapps.fdc.myflorida.com. FDC data is a different bucket. It covers people sent to state prison after sentencing. County jail data and FDC data should not be added together. They cover different stages of the case life cycle.
The official Sheriff Corrections Bureau page is the right starting point for any Lee County jail population lookup.
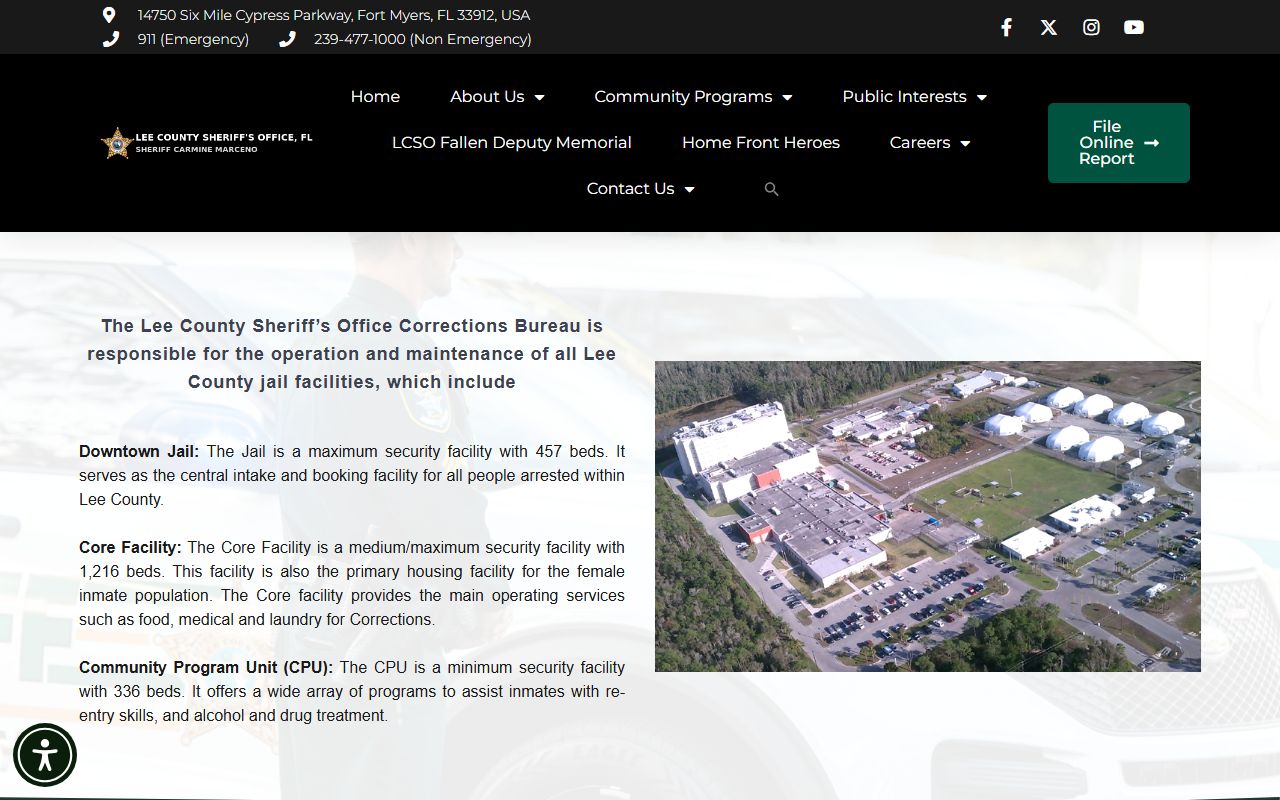
The Corrections Bureau page sets the frame for every other number on this page. All counts below come from that source unless a research gap is flagged.
Lee County Jail Capacity Overview
The Lee County Sheriff lists three correctional sites with a combined rated capacity of 2,009 beds. The Downtown Jail is the central intake and booking site. The Core Facility is the largest of the three and serves as the primary female housing site. The Community Program Unit handles the lowest security tier and runs re-entry and treatment work. Each site holds a distinct role inside the Lee County jail population.
| Facility | Security / Role | Rated Capacity |
|---|---|---|
| Downtown Jail | Maximum security; central intake and booking | 457 beds |
| Core Facility | Medium / maximum; primary female housing; food, medical, laundry | 1,216 beds |
| Community Program Unit | Minimum security; re-entry and alcohol / drug treatment | 336 beds |
| Total | All listed Lee County corrections sites | 2,009 beds |
Bed capacity is not the same thing as live count. A bed can sit empty for a shift while the next booking moves through intake. The Core Facility carries more than half of all rated beds in Lee County. It is the workhorse of the system. Downtown is smaller but every new arrest in the county runs through it first. The CPU is the smallest site and the most program-heavy.
Capacity by itself does not tell the full story. A jail can run near full and still meet its rated count. It can also dip well below. The ratio of average daily population to rated capacity is the figure to watch over time. That ratio shows whether bed pressure is rising or easing inside the Lee County jail.
Average Daily Population
The Sheriff's Corrections Bureau page reports an average daily population of 1,606 in 2024. The prior-year figure is 1,523. That is a year-over-year change of plus 83 inmates, or about a 5.45 percent rise. Set against the rated 2,009-bed total, the 2024 average daily count puts the Lee County jail system at roughly 79.9 percent of stated bed capacity. The prior year sat near 75.8 percent.
| Year | Average Daily Population | Capacity Ratio |
|---|---|---|
| 2024 | 1,606 | ~79.9% |
| Prior year (2023) | 1,523 | ~75.8% |
| Year-over-year change | +83 inmates | +5.45% |
An average daily population is not a peak count. Peak days can run higher. Slow days can run lower. The figure smooths out daily noise from weekend bookings, court releases, and transfers. It is the cleanest single number for jail-size context. The Lee County jail population trend, on the face of the official page, points up. A 5.45 percent rise in one year is not flat. It is also not a surge.
The 2024 ratio sits below the 85 to 90 percent band where jail planners start to flag bed pressure. Lee County is busy but, on these official numbers, not over its stated combined count.
Demographic Breakdown
The Sheriff's Corrections Bureau page does not publish an aggregated demographic table for the Lee County jail population. There is no current page that breaks the daily count by race, sex, or age band in aggregate. The Core Facility is the only piece of the public capacity table that names a population type. It is the primary female housing site for the system.
At the individual-record level, public booking data does show race, sex, birth date, height, weight, and hair fields. Those fields appear in each booking record on the Sheriff's public booking search. They are not rolled up into a published demographic profile of the jail as a whole. A research project that wanted a true Lee County jail demographic snapshot would need to harvest the booking feed over a fixed window and roll it up by hand.
Anyone who needs an official demographic count should treat the Lee County jail demographic question as an open public-records issue. A Chapter 119 request to the Sheriff is the standard route. The request would target aggregate counts, not personal record content.
Pretrial vs Sentenced Population
The Lee County Sheriff does not post a pretrial-versus-sentenced split for the Lee County jail population on the Corrections Bureau page. The official page lists capacity and average daily population. It does not separate inmates who are waiting for trial from inmates who are serving a county jail sentence.
National framing helps set context here, though it is not Lee County data. Bureau of Justice Statistics work has shown that a large share of the people in local jails across the country are unconvicted and waiting for case action. That national pattern does not get applied as a Lee County number. The Lee County share is unknown on the face of official Sheriff data.
For a case-by-case view, the Lee Clerk MATRIX system shows whether a person has a pending case, an active bond, a hearing date, or a disposition. That data is per-case, not system-wide. To roll up a true Lee County pretrial share, the data would have to be pulled across every active case in the jail and matched to the booking list.
Misdemeanor vs Felony Population
A misdemeanor-versus-felony split for the Lee County jail population is also not posted on the official Sheriff page. The Corrections Bureau page does not group inmates by charge grade. The booking system shows charge codes and offense descriptions on each record, but it does not publish a rolled-up share of the jail by felony or misdemeanor.
The split matters for context. Felony bookings tend to stay longer. Misdemeanor bookings often clear fast, sometimes the same day. A jail with a heavy felony share will look different on length-of-stay even if average daily population is flat. None of that mix data is published for Lee County in aggregate. The comparison framing is general, not Lee-specific.
County Court in Lee County handles misdemeanors and lower-grade cases. Circuit Court handles felonies and major civil work. Anyone tracking the charge mix would need to cross-reference Sheriff booking data with case-grade data from the Clerk. That work is not done for the public on a single official page.
Mental Health and Medical Population
The share of the Lee County jail population receiving mental health or medical care is not posted on the Corrections Bureau page. The Core Facility is named as the main site for food, medical, and laundry services for the system, which signals that medical operations are centered there. The page does not name a mental-health unit or a posted count of people on a mental-health caseload inside the jail.
This is a research gap. Without a published count, any number used in print would be invented. The Sheriff's public Corrections content does not break out a medical or mental-health subgroup of the jail's average daily population.
National and State Context
The Bureau of Justice Statistics is the standard national source for jail population framing. BJS reports cover total local jail population, rated capacity at the national level, average length of stay, and the share of jail residents who are unconvicted. Vera Institute and the Prison Policy Initiative track similar metrics by county and state, drawing on BJS and state correctional reports. Those national numbers help readers place the Lee County jail count in a wider frame.
A clean county-versus-state-versus-national table per 100,000 people is not safe to publish here without Lee-specific research-backed inputs. The Sheriff Corrections Bureau page reports a system total in absolute beds and absolute average daily population. It does not report a rate. A rate would require a per-100,000 calculation against an official Lee County resident count and a matched-year state and national figure. That work is not done on the public Sheriff page.
For state-prison context, the Florida Department of Corrections runs the inmate population search noted earlier. FDC reports cover felony offenders sentenced to state prison or state supervision. They do not include county jail counts. State-prison counts and county-jail counts answer different questions.
The Sheriff's Corrections Bureau page also references programs that affect how the jail uses bed days. The Community Program Unit hosts re-entry skills and alcohol and drug treatment. The system runs a Cell Dog Program and a Day Work Program. GED testing is offered through an on-site Pearson VUE test center, along with religious and educational services. Each of these programs takes people out of straight custody time and into program time, which shapes the makeup of the daily count without changing the headline number.
Population Trends Over Time
On the face of the Lee County Sheriff Corrections Bureau page, the trend that is most clearly published is 2024 versus the prior year. Average daily population rose from 1,523 to 1,606. That is a rise of 83 inmates, or 5.45 percent. Both figures track against a stated combined capacity of 2,009 beds.
A longer trend is a research gap. The current Corrections Bureau page text does not list a five-year or ten-year series. Older Sheriff budget and annual report material has shown system charts for prior years, but those values are not anchored on the current public page. The official current-page values should be treated as the live build inputs. Older numbers should be sourced from a current Sheriff annual report when one is harvested, not assumed from memory.
For people who want to watch the Lee County jail population month by month, the right move is to bookmark the Sheriff Corrections Bureau page and re-check it. The page is where the official average daily population number is refreshed.
Searching for Lee County Inmate Records by Name
This page covers aggregate jail population data. It does not search for a specific person in custody. For name-based custody lookups in Lee County, use the Lee County inmate records page, which routes to the live Sheriff booking search and to state and federal locators when needed.
Where the Lee County Jail Population Data Comes From
The official anchor for Lee County jail population data is the Lee County Sheriff's Office Corrections Bureau page at sheriffleefl.org/corrections-2. The Sheriff is the agency that runs the Downtown Jail, the Core Facility, and the Community Program Unit. The Sheriff is also the agency that publishes rated capacity and average daily population numbers for the county.
Public records access to deeper jail data runs through Florida Statutes Chapter 119. The Sheriff's own booking search page states that the online database is provided as a courtesy and should not substitute for a Chapter 119 public records request. That language is meant for the booking search, but it applies to aggregate population questions as well. Anyone who needs a number that is not posted on the Corrections Bureau page can file a public records request with the Sheriff.
The Florida Department of Corrections inmate search at pubapps.fdc.myflorida.com is the official source for state-prison population data. FDC numbers cover felony offenders held in state prison or under state supervision. They are separate from any Lee County jail count.
For an image-based view of the FDC search page, the screenshot below shows the state inmate search portal.
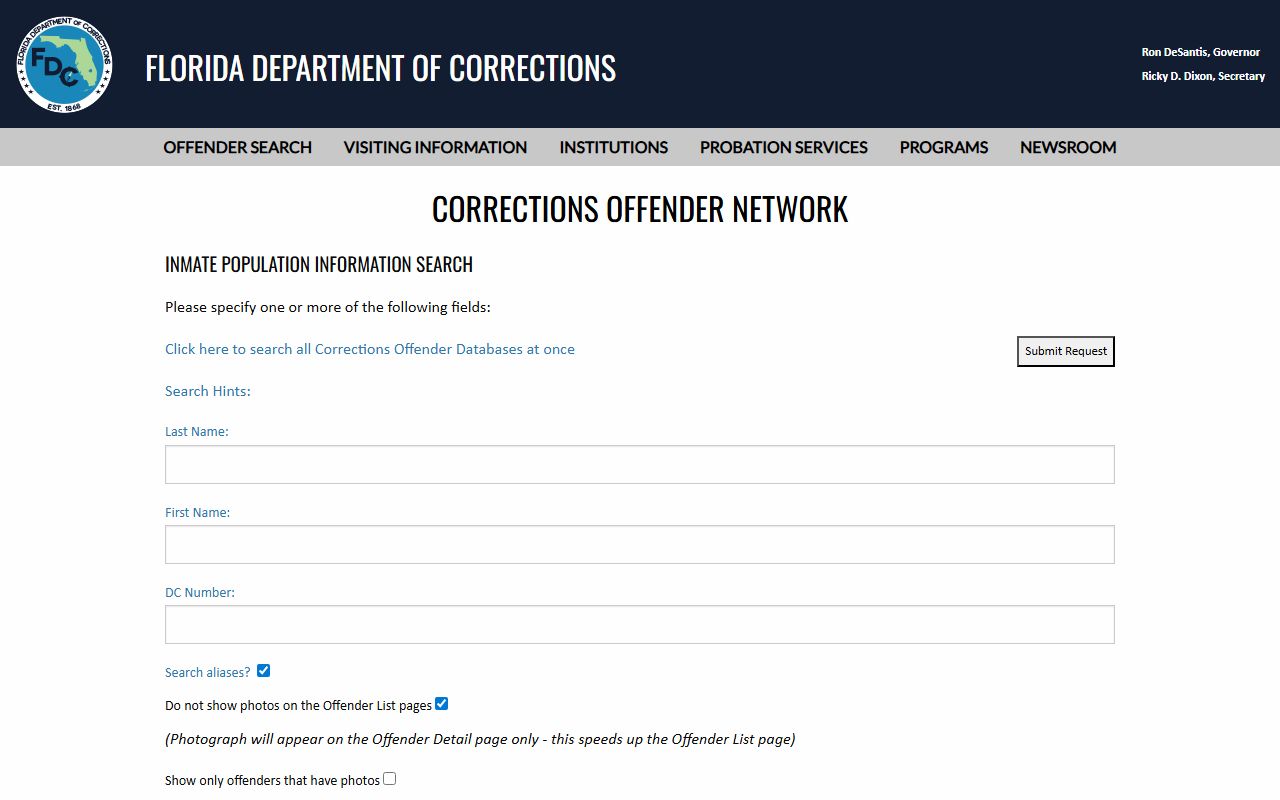
The FDC search is the right place for state-prison numbers, not for county jail population. The two data sets answer different questions and should never be merged in a single count.
For related Lee County data and lookups, see Lee County inmate records, released inmates, Lee County warrant records, and arrest records.
Note: Lee County jail population numbers refresh on the Sheriff Corrections Bureau page once a year and may not match a live in-custody total at any given moment.